The ‘uHoo Virus Index’ is a patent pending technology that uses the power of air quality data to
help you know how suitable your home/workplace is for viruses to survive and how your air quality
affects your health and immune system.
 |
|
Using Indoor Air
Quality Data to
Create the uHoo
Virus Index
|
Why Indoor Air
Quality Matters
COVID-19, or the coronavirus, has drastically changed our routines. Due to the lockdowns put in place in affected regions around the
world, people are spending more time indoors than ever. And that’s a big point of concern when talking about air quality because indoor
air is usually two to five times worse than outdoor air.
Before the COVID-19 pandemic began, people were already spending a lot of time indoors, which has been intensified by efforts to combat or slow the spread of the disease. For many people, they are unaware that the air they are breathing indoors is often more polluted than outside air. This can induce anxiety as our homes are supposed to be the place where we feel the safest.
|
|
“We can then utilize air
quality data within our
homes and workplaces to
create an environment
that helps to deactivate
viruses and to enhance
our immune system.”
Research has shown that air quality and COVID-19, together with other viruses, are correlated. We can then utilize air quality data within our homes and workplaces to create an environment that helps to deactivate viruses and to enhance our immune system.
uHoo’s goal is to empower you to make better decisions about your health and your home/workplace environment using accurate and actionable air quality data.
|
uHoo Virus Index
The ‘uHoo Virus Index’ is a patent pending technology that uses the power of air quality data to help you know how suitable your home/workplace is for viruses to survive and how your air quality affects your health and immune system.
Various factors affect air quality, including your unique habits and spaces, and it’s important to take these into consideration.
With uHoo, your air quality data can be transformed into actionable insights.
The table below shows you the uHoo Virus Index. It ranges from 1 to 10 sub-categorized into 4 levels.
1 to 3 (Good)
|
Virus survival is low and airborne virus spread is unlikely.
|
4 to 6 (Mild)
|
Virus survival is moderate and airborne virus spread is
possible but air quality poses little to almost no direct health risk for people who are usually not sensitive to air pollution. Sensitive people may experience health effects. More attention to air quality should be
given and actions to improve air quality is recommended.
|
7 to 8 (Bad)
|
Virus survival is prolonged and airborne virus spread is likely. Air quality poses some health risk. Critical assessment of your air quality is necessary and actions to improve air quality is required.
|
9 to 10 (Severe)
|
Virus survival is high and airborne virus spread is likely.
Air quality would affect most people and actions to improve air quality is necessary.
|
These levels are determined based on scientific analysis of five air quality factors which includes temperature, relative humidity, PM2.5, Carbon Dioxide, and Nitrogen Dioxide. Let’s look at how these factors affect your uHoo Virus Index.
Ideal Ranges
Temperature 
19°C to 24°C (66°F to 75°F)
According to research by Casanova Lisa, et al.,
published in the American Society of Microbiology1, the infection rate of viruses is significantly reduced at room temperature (20°C or 68°F) compared to colder temperatures (e.g. 4°C or 39°F). Whereas, at warmer temperatures (30°C or 86°F), transmission of influenza viruses is blocked or becomes highly inefficient. Maintaining temperature at the ideal level not only lessens the risk of virus transmission but also keeps you comfortable indoors.
Relative Humidity 
40% - 60%
In environments with lower than 40% Relative
Humidity (RH), droplets from a cough or a sneeze lose their moisture quickly. This results in droplets becoming ‘dry aerosols’ and capable of staying in the air for longer periods. Viral particles remain infectious much longer below 40% and above 80%.
Virus particles are most inactive at 50% humidity, and retain their infectiousness the further from that median value, plateauing at 20% and 80%,respectively2. Staying within 40% to 60% relative humidity is ideal from a comfort perspective but 50% is the most ideal in terms of fast virus inactivation.
Keeping the humidity at the ideal range not only helps you stay comfortable but also keeps you healthy. Low humidity (less than 30%) may promote dry nasal passage which makes people more susceptible to cold viruses while high humidity (more than 70%) may promote mold growth which can be harmful to people with weakened immune systems.
|
|
PM2.5 
Below 15µg/m3
Particulate Matter also known as “Particle Pollution” is a complex mixture of extremely small particles and liquid droplets. Particulate Matter at 2.5 microns in size or smaller can be inhaled deep into the lungs and cause irritation and corrosion of the alveolar wall, which impairs lung function3. They are also known to carry microbiomes4. These particles are small enough to stay suspended in the air. A study conducted by Feng,Cindy et al published in the Journal of Environmental Health5 showed an increased vulnerability to influenza-like illnesses when levels of PM2.5 were above the ideal range. The data suggests that PM2.5 stays airborne longer,
creating a “condensation nuclei” which virus droplets attach to. These are then inhaled by people, resulting in infection.
Thus, it is best to keep your PM2.5 levels low to minimize risk of infection.
Examples of sources of PM2.5 indoors: smoking,cooking, candles, space heaters, furnaces, and poorly-maintained HVAC system.
|
Ideal Ranges
Carbon Dioxide
Below 800ppm
Carbon Dioxide has long been used as an indicator of good indoor air quality primarily because of its association with ventilation. When carbon dioxide levels are high, it may indicate that your space is not well ventilated. The ideal level of CO2 is needed to reduce the risk of lung inflammation(6).
Chronic inflammation caused by persistent high CO2 levels is not ideal for your health. Moreover, longer exposure to high CO2 can cause fatigue, headaches, and dizziness. It is also possible to develop hypercapnia acidosis6, characterized by increased levels of carbon dioxide in the blood. This suppresses immune function and can make
one more susceptible to disease.
Some causes of carbon dioxide elevation indoors: improperly maintained combustion devices and
poor ventilation.
|
|
Nitrogen Dioxide  (NO2) (NO2)
Below 53ppb
High levels of Nitrogen Dioxide indoors is the result of outdoor NO2 entering your indoor environment as well as combustion sources inside the home / workplace. According to a study published in the Environmental Research journal, short-term exposure can irritate airways while long-term exposure can lead to chronic illness and respiratory infections with viruses(7). Asthmatics may also experience longer symptomatic periods and increased medication use for children.
Examples of sources of nitrogen dioxide:
Automobiles from attached garage or near a busy street, appliances with defective installations, gas stoves, kerosene heaters, chimneys, etc.
|
How do these Parameters Differ from Standards
When it comes to dealing with viruses, the lower the risk the better. The thresholds set in uHoo’s Virus Index are different from the default air quality safety thresholds set inside the uHoo app, which is based on US EPA, the World Health Organization (WHO) and the Occupational Safety and Health Administration (OSHA) standards. The uHoo Virus Index thresholds are based on specific environments, derived from scientific research conducted by governments, scientists, and universities, suitable for viruses to survive. It has stricter guidelines compared to the air quality
safety thresholds set by the above mentioned organizations.
In-Depth Analysis: Air Quality & COVID-19
COVID-19 is a highly infectious disease compared to its 2003 counterpart, SARS. Its health effects
vary among people from having no symptoms at all to having severe respiratory distress. According to the CDC8, people with serious underlying medical conditions are “at higher risk for severe illness from COVID-19.”
Scientists also found that air pollution contributes to the severity of the disease. A nationwide
study9, conducted by Harvard University, showed that counties in the USA with high levels of air
pollution before the COVID-19 crisis have higher death rates (defined as COVID-19 deaths per total population).
Can Coronavirus Travel in the Air?
Research groups have suggested that air pollution particles could help coronavirus travel further in the air (10).
A statistical analysis(11) conducted by scientists from various Italian Universities and Health Institutions showed correlation between
higher levels of particle pollution and higher rates of infection in parts of northern Italy before a lockdown was imposed. It’s important to take note that this study has not been peer-reviewed as of the writing of this paper (May 2020).
|
|
In contrast, a peer-reviewed research study conducted by Wei Su et. al published in the BMC journal found that high levels of particulates in the air corresponded to more cases of influenza and influenza-like illnesses during the flu season12.
Previous studies have also shown that air pollution particles harbour microbes4, and that pollution is likely to have carried the viruses causing bird flu, measles, and foot & mouth disease over considerable distances.
|
How Does COVID-19 Spread?
Research groups have suggested that air pollution particles could help coronavirus travel further in the air (10).
A statistical analysis(11) conducted by scientists from various Italian Universities and Health Institutions showed correlation between higher levels of particle pollution and higher rates of infection in parts of souhern Italy before a lockdown was imposed. It’s important to take note that this study has not been peer-reviewed as of the writing of this paper (May 2020).
|
|
How Air Pollution & Indoor Air Quality Affect Mortality Rate
In contrast, a peer-reviewed research study conducted by Wei Su et. al published in the BMC journal found that high levels of particulates in the air corresponded to more cases of influenza and influenza-like illnesses during the flu season12.
Previous studies have also shown that air pollution particles harbour microbes4, and that pollution is likely to have carried the viruses causing bird flu, measles, and foot & mouth disease over considerable distances.
|

Ways to Maintain Good Air Quality
Now that we know how vital good air quality is to reduce our susceptibility to viruses, let’s look at some practical tips below based on the uHoo Virus Index.
Keep your Temperature and
Humidity under Control
WHO’s Guide For Worker Safety15 in March 2020 notes that a person can be infected by touching contaminated objects or surfaces, and then touching their face.
According to The National Institute for Public Health and the Environment of the Netherlands (RIVM)16, under the right conditions, SARS-CoV2, the virus that causes COVID-19, can survive outside of the body for several hours and surfaces for several days.
Aside from good personal hygiene and cleaning surfaces, there are ways to lessen our risk of getting infected through the right management of temperature and relative humidity. A study published in the American Society for Microbiology1 found that the right level of humidity rendered more SARS-CoV surrogate viruses unable to infect, a process called viral inactivation.
Here are the results of their study:
- The greatest level of virus inactivation took place at 50%RH.
- The lowest level of virus inactivation took place at 20%RH.
|
|
- Inactivation was more rapid at 20°C (68°F) than at 4°C (39°F) at all humidity levels.
- There was greater survival for viruses at low RH (20%) and high RH (80%) than at moderate RH (50%).
- Infectious virus deposited on stainless steel surfaces stayed for at least 3 days at 50%RH (20°C) and for up to 28 days at 20%RH.
The results show that keeping Relative Humidity at 50% and a temperature of 20°C lessens your risk in being infected as it
promotes faster virus inactivation. Thus, it’s essential that healthcare facilities, offices, and homes keep the humidity at the ideal range to reduce transmission risk of COVID-19 in indoor environments. However, it is important to note that virus particles on smooth steel surfaces can last up to 3 days at 50%RH and 20°C, more so, if the temperature and humidity is lower than that. Disinfecting surfaces should still be an important part of our daily routine.
|
To understand this data better and its implication on our health, let’s look at the charts below, from the study conducted by Lisa M. Casanova, et al published in the American Society for Microbiology(1).
Chart 1: Inactivation of SARS-CoV Surrogate TGEV at 4°C and at different humidities.
Fastest inactivation of viruses happened at 50%RH.
Knowing our infection risk using temperature and humidity is essential in maintaining a healthy indoor environment where we spend 94% of our time.
This chart shows that in dry indoor air at 20°C and 20% RH, 80% of coronaviruses remain viable on surfaces for a week. This significantly increases our infection risk through touch, resuspension, and inhalation of virus particles. Humidifying your home or office to 50% RH reduces viable viruses to less than 1% after two days, which significantly decreases infection risk.
Chart 2: Inactivation of SARS-CoV surrogate TGEV at different temperatures and humidities.
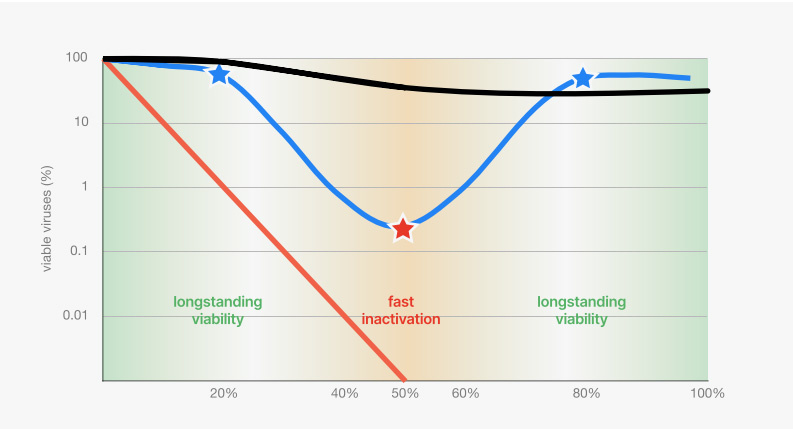
Fastest inactivation at all temperatures is at 50% RH.
Virus particles are most inactive at 50% humidity, and retain their viability the further from that median value, plateauing at 20% and 80% respectively as represented by the blue line.
At 20°C (68°F) with dry air (20%RH) and humid air (80% RH) coronaviruses survive for up to two to three days as represented by the blue star. At 20°C (68°F) with 50%RH, on the other hand, less than 1% of the viruses remain viable after 1 day as represented by the red star.
The study also showed that low temperatures increase the persistence of viable viruses (black line) while high temperatures decrease the persistence of viable viruses (red line), on inanimate objects such as stainless steel.
What does this data mean?
Dr. Walter Hugentobler from the University of Zurich states:
“This study clearly shows that maintaining a mid-range humidity in hospitals and healthcare establishments would be an effective measure to reduce the risks of coronavirus transmission. Although this study
set out to gain insight into potential measures to control SARS-CoV (the virus of the SARS pandemic in 2002/2003), the results are most
likely relevant to the spread of COVID-19, the disease transmitted by SARS-CoV-2, a coronavirus genetically very close to SARS-CoV.”(17)
How does Temperature Affect the Spread of Viruses?
Ambient temperature can have a strong influence on the activity and spread of viruses. For example, other viruses that cause respiratory infections often occur in the winter months. According to Frank van
Kuppeveld, professor of virology at Utrecht University, this stems from reduced resistance of the mucous membranes18 in the nose when cold air is inhaled. Keeping the temperature at the ideal range indoors, 19°C to 24°C (66°F to 75°F), helps you avoid drying of the nasal passage that makes you more susceptible to viruses.
|
|
How does Relative Humidity
Affect the Spread of Viruses?
Scientists from the Department of Epidemiology and Biostatistics in Peking University (19) proposed that the moisture in exhaled bioaerosols quickly evaporates in a low-humidity environment, which then forms into airborne droplet nuclei. When the fluid of pathogenic droplets quickly evaporates, it allows them to stay suspended in the air for a long time.
This is supported by another study
conducted by the US CDC (20) on the effect of
relative humidity on aerosolized viruses. They
found that rapid inactivation of viruses happens at relative humidity of 43% even if they are suspended in the air. Maintaining an indoor relative humidity at the ideal range will then significantly reduce the infectivity of aerosolized viruses.
|
Get Fresh Air and Maintain
Good Ventilation
For people living in apartments, fresh air is a precious resource. To keep the air healthy in these spaces, what you can do is to replace your HVAC filters more often than normal, install ventilation fans, and keep the house free of dust to reduce particulate matter in
the air.
If you live in a home with more windows, you can open them at regular times each day to let fresh air in. However, you have to take
note that outdoor pollution can also enter and increase PM2.5 levels indoors. Improving the filter used in your HVAC system can significantly reduce the amount of PM2.5 entering your home. Houses with bigger spaces can also put up plants to help improve the air.
At your workplace, you need to make sure that the building’s ventilation system is working efficiently and is able to ensure an
effective flow of fresh air so that the stale air inside the workplace can be dissipated.
Aside from good ventilation, our activities can also have an impact on our indoor air.
Cooking, for example, generates a high amount of PM2.5. Maintaining good ventilation is crucial to lessen health risks.
|
|
Maintain Good Ventilation
while Cooking
Research conducted by Jennifer M. Logue, et al, published in the Journal of Environmental Health Perspectives, showed that cooking is a major source of PM2.521. The small particulates generated from heat combustion are small enough to stay suspended in the air indefinitely, increasing the risk of inhaling them. Once inside your lungs, they can cause irritation or damage to your respiratory system.
|
How to Reduce High PM2.5
Levels while Cooking
According to researchers from the Netherlands TNO, there are four factors that can increase PM2.5 levels in the air while cooking. These include:
Cooking Method. The level of PM2.5 released during cooking is highly dependent on three things - cooking with lids, cooking using gas
or induction, and the type of dish. Meat frying, in particular, releases PM2.5 more than other dishes. Using induction instead of gas is
more efficient. However, the type of dish being cooked is still a big factor.
Type of Range Hood Used. Aside from using motorized hoods, improving flow rate and adding a damp buffer can significantly reduce
PM2.5 levels. According to the study22 done by Jacobs, Cornelissen, & Borsboom published in the Indoor Air Conference at Ghent, these have reduced PM2.5 levels from above 800 µg/m3 (unhealthy level) to below 100 µg/m3 (moderate level).
Amount of Ventilation in Relation to the Size
of the Kitchen/Living Room.
The right ventilation must be used in order for PM2.5 to quickly dissipate after cooking. Using the wrong ventilation will cause PM2.5 to stay in the air longer.
|
|

Impact of Energy Recovery
Ventilator and Kitchen Exhaust Hood
A study conducted by Jinglin Jiang and Dr. Brandon Boor of Purdue University in collaboration with Whirlpool, utilized uHoo
sensors to test the effect of Energy Recovery Ventilator (ERV) and range hood ventilation on reducing PM2.5 levels indoors. Using stir
frying as a cooking method, they observed that PM2.5 can be reduced within 15 minutes when both the ERV and hood are turned on23.
When both are turned off, it took approximately one hour to reach the same level of PM2.5 before cooking started. This means there are higher chances for people to breathe in higher amounts of PM2.5 when ventilation is insufficient.
|
Be Careful in Using Cleaning Products
During the COVID-19 pandemic, people are regularly disinfecting their homes with sprays and wipes. While these items are useful for
killing viruses, disinfecting products contain VOCs24, which can trigger allergies and weaken immune system (24).
According to the US EPA, VOCs or Volatile Organic Compounds are emitted as gases from certain solids or liquids. VOCs include a
variety of chemicals, some of which may have short- and long-term adverse health effects25. They can also react with other chemicals in the air and become more dangerous to human health.
Although using disinfectants is a recommended step to prevent virus infection from our hands or surfaces, it must be done in a way that it does not affect our lungs and overall health.
|
|
Exposure to VOCs over 24 hours can irritate the lungs, causing nausea and making it difficult to breathe. Long term exposure to
harmful VOCs over months can affect the liver, kidneys, and central nervous system. You can reduce VOCs in your home through
proper ventilation. Opening a window will allow the trapped gases to escape and will dilute any remaining VOCs with fresh air.
Another way is to get a purifier with a carbon filter that can trap VOCs. Knowing the specification of a purifier is important because not all can clean VOCs. Some purifiers also emit ozone (O3) while cleaning which can cause respiratory conditions. Having an indoor air sensor, such as uHoo, helps you know if your air purifier actually works and is safe for your family.
You may also want to consider changing cleaning products you use to ones that are low VOC. This helps you to reduce the actual
source.
|
Avoid Polluting Compounds
Nitrogen Dioxide is considered as one of the most polluting compounds in the air. NO2 is produced by automobiles and other kinds of combustion.
Long-term exposure to NO2 may cause a wide spectrum of severe health problems such as hypertension, diabetes, heart and
cardiovascular diseases, and even death. NO2 can also form indoors when fossil fuels like wood or natural gas are burned. Current
guidelines by the WHO says that one hour exposure to 106 ppb of Nitrogen Dioxide26 is acceptable.
At about twice this level, asthmatics may find it harder to breathe due to reduced pulmonary function. For normal people, breathing in NO2 at this level can cause slight difficulties in breathing.
|
|
Yaron Ogen, a scientist from Tel-Aviv University, examined the relationship between long-term exposure to NO2 and coronavirus
fatality in Italy, Spain, France and Germany (27). The number of death cases caused by COVID-19 were taken from 66 administrative regions. Results show that out of the 4,443 fatality cases, 3,487 (78%) were in five regions located in north Italy and central Spain. Additionally, the same five regions show the highest NO2 concentrations combined with downwards airflow which prevented an efficient dispersion of air pollution. The chart below shows that most of the fatalities occurred in high concentrations of NO2 ranging between 100 to 300, where NO2 readings between 177 and 294 µg/m3 making up 83% of it. These results indicate that the long-term
exposure to NO2 may be one of the most important contributors to fatality caused by the COVID-19 virus in these regions and most
likely across the world. |


Try to get a Good Night’s Sleep
Poor air inside bedrooms greatly reduces quality of sleep.
Research conducted by scientists from Tsinghua University found that an increase of 77.5 points in the Air Quality Index (AQI) was able to reduce a person’s amount of sleep by more than half an hour per day28. An AQI reading of 77.5 is considered to be in the moderate range.
These research studies are consistent with the findings of scientists from Harvard, Yale and Emory University studying the effect of
black carbon29 on an adult's quality of sleep. An increase of 0.21 µg/m3 of black carbon resulted in 23 to 25 minutes of less sleep per
day. Some sources of black carbon include diesel engines, residential fuels, burning, and other industrial processes. Aside from having
less sleep, black carbon increases risks of developing cardiovascular and respiratory diseases which weakens immune systems.
Good air quality is not only important for healthy lungs but also healthy sleep. Research done by Luciana Besedovsky, Tanja
Lange, and Jan Born published in the US National Library of Medicine showed that good sleep promotes a healthy immune system30, which is crucial in keeping virus symptoms at bay. The immune system is
strongly-linked to the circadian sleep-wake rhythm, and poor sleep can increase the risk of getting sick.
|
|
Stop any Kind of Smoking
Tobacco smoke can negatively impact air
quality, even if you yourself don’t smoke.
Smoke from cigarettes, cigars, or pipes
contains over 70 chemicals known to cause
cancer. The US CDC estimated that
secondhand smoke31 has contributed to
around 2.5 million nonsmoker deaths since
1965.
Tobacco smoking also has long lasting
effects. Research done by Peyton Jacob III, et
al on the effects of “Thirdhand Smoke”,
published in the US National Library of
Medicine showed that tobacco smoke residue
produces secondary organic pollutants32 and
releases VOCs over time.
Opening windows and turning on an air
purifier may help reduce the concentration of
smoke in your home, but keep in mind that
the best level of tobacco smoke is to not have
any at all.
|
Know What You’re Breathing In?
“Make the invisible, visible.”
Like viruses, air pollution cannot be eliminated when we cannot see what we are dealing with. Seeing the problem allows us to create
solutions that actually work instead of guessing.
The only way to make the problems in the air visible is by using an indoor air quality monitor. So how can uHoo help?
uHoo Is Your First Step - It Gives You Actionable Insights
uHoo helps people make the right choices based on their air quality. Each person has unique habits, homes and workplaces and it’s
important to take this into consideration when addressing indoor air quality.

|
|
uHoo Helps You Know Your Air So You Can Take The Right Action
Research has consistently shown that air
quality has a strong impact on health. Our immune system not only relies on the kind of food we eat but also the air we breathe. uHoo would be able to help you stay healthy and strong by providing insights on what air quality issues we have and how these affect our health.
The uHoo Virus Index goes the extra mile to help you take control of your nvironment and help you understand how suitable your home/workplace is for viruses to survive. The uHoo Virus Index utilizes data on temperature, relative humidity, PM2.5, carbon dioxide and nitrogen dioxide in calculating the index. It also tells you which specific air quality factors you need to address so you can immediately take action.
uHoo Helps You Automate Things at Home and at the Workplace
uHoo complements your HEPA air purifiers, humidifiers, ventilation system, etc. by providing you with data and insights on how to effectively use them. You can also use uHoo to control your other equipment, be it at home or in the workplace, to automatically respond based on what uHoo detects.
|
Conclusion
Taking care of your air quality and making sure it is at optimal levels increases virus inactivation and helps to keep your immune
system healthy. Knowing how to fight an invisible enemy using
uHoo allows us to make educated decisions about our health and measure the impact of our actions. Now that we are living in the new
normal and spending most of our time indoors, gaining insights about our indoor air and how it affects our immune system is more
important than ever.
The uHoo Virus Index and all parameters that uHoo measures gives us the ability to know what action to take to maintain a healthy
indoor environment whether at home or in the workplace. Taking care of the space where we work and live, by keeping air quality
healthy, is more than just for our own benefit, it’s also about saving lives.
Disclaimer
The uHoo Virus Index is intended to provide you information on indoor air quality to help you know how suitable your home/workplace is for viruses to survive and how the air quality affects your health and
immune system. The uHoo Virus Index is not, and is not intended, for use in detecting, in any manner, the presence of any kind of virus or bacteria in your area.
With the uHoo Virus Index, your air quality data can be transformed into actionable insights. Nevertheless, users should exercise their own independent judgment in conjunction with implementing such actions with proper cleanliness and sanitation measures. We at uHoo do not take responsibility for any decision taken by the user based solely on the information provided by uHoo. Users are solely responsible for any action that they may take.
|

|
References
1. Casanova Lisa, et al. “Effects of Air Temperature
and Relative Humidity on Coronavirus Survival on
Surfaces.” Applied and Environmental
Microbiology, American Society for Microbiology,
2010.
2. Lowen, Anice and John Steel. “Roles of
Humidity and Temperature in Shaping Influenza
Seasonality.” Journal of Virology, American Society
for Microbiology, 2014.
3. Yu-Fei, Xing, et al. “The impact of PM2.5 on the
human respiratory system.” Journal of Thoracic Disease,
8 Jan. 2016.
4. Qin, Nan, et al. “Longitudinal survey of
microbiome associated with particulate matter in a
megacity.” Genome Biology, 3 Mar. 2020.
5. Feng, Cindy, et al. “Impact of ambient fine
particulate matter (PM2.5) exposure on the risk of
influenza-like-illness: a time-series analysis in
Beijing, China.” Environmental Health, 11 Feb. 2016,
6. Jacobson, Tyler, et al. “Direct human health
risks of increased atmospheric carbon dioxide.”
Nature Sustainability, 8 Jul. 2019.
7. Becker, Susanne and Joleen Soukup. “Effect of
Nitrogen Dioxide on Respiratory Viral Infection in
Airway Epithelial Cells.” Environmental Research,
Science Direct, Aug 1999.
8. “People Who Are at Higher Risk for Severe
Illness.” Centers for Disease Control and
Prevention, 14 May 2020.
.
|
9. Wu MS, Xiao, et al. “COVID-19 PM2.5.” Harvard
University, 24 Apr. 2020,
10. Martelletti, Luigi and Paolo Martelletti. “Air
Pollution and the Novel Covid-19 Disease: a
Putative Disease Risk Factor.” Nature Public Health
Emergency Collection, PMC, 15 Apr. 2020,
11. Setti, Leonardo, et al. “The Potential role of
Particulate Matter in the Spreading of COVID-19 in
Northern Italy: First Evidence-based Research
Hypotheses.” medRxiv, Cold Spring Harbor
Laboratory, 17 Apr. 2020,
12. Su, W., Wu, X., Geng, X. et al. The short-term
effects of air pollutants on influenza-like illness in
Jinan, China. BMC Public Health 19, 1319 (2019).
13. Lewis, Dyani. “Is the coronavirus airborne?
Experts can't agree.” Nature, 2 Apr. 2020,
14. Yu, Ignatius, et al. “Evidence of Airborne
Transmission of the Severe Acute Respiratory
Syndrome Virus.” The New England Journal of
Medicine, 22 Apr. 2004,
15. “Getting your workplace ready for COVID-19.”
World Health Organization, 3 Mar. 2020,
16. “Blijft het coronavirus op voorwerpen in leven?
En zo ja, hoe lang?” RTLNieuws, 24 Mar. 2020,
|
References
17. Hugentobler, Walter. “Dry indoor environment -
Cause for seasonal flu in temperate climate?”
University of Zurich,
18. “Gaan lentetemperaturen ons beschermen
tegen het coronavirus?” Nu, 25 Feb. 2020,
19. Wu, Yu, et al. “Effects of temperature and
humidity on the daily new cases and new deaths
of COVID-19 in 166 countries.” ScienceDirect, 17
Apr. 2020.
20. Noti, John, et al. “High Humidity Leads to Loss
of Infectious Influenza Virus from Simulated
Coughs.” Plos One, 27 Feb. 2013.
21. Logue, Jennifer. “A Method to Estimate the
Chronic Health Impact of Air Pollutants in U.S.
Residences.” Environmental Health Perspectives, 1
Feb 2012.
22. Jacobs, Piet, et al. “Energy efficient measures
to reduce PM 2,5 emissions due to cooking.”
Research Gate, Jul. 2016.
23. Jiang, Jinlin et. al “ Investigating how energy
use patterns shape indoor nanoaerosol dynamics
in a net-zero energy house.” Dec. 2018,
24. “VOCs in Cleaning/Sanitizing Products and
Health.” Berkeley Lab, 2020.
25. “Technical Overview of Volatile Organic
Compounds.” US EPA, 2020.
|
26. Jarvis, Debbie, et al. “WHO Guidelines for
Indoor Air Quality: Selected Pollutants.” NCBI,
2010.
27. Ogen, Yaron. “Assessing nitrogen dioxide
(NO2) levels as a contributing factor to
coronavirus (COVID-19) fatality.” Science Direct, 7
Apr. 2020.
28. Yu, Hongjun, et al. “The Association between
Air Pollution and Sleep Duration: A Cohort Study of
Freshmen at a University in Beijing, China.” PMC,
16 Sept. 2019.
29. Fang, Shona, et al. “Traffic-related air pollution
and sleep in the Boston Area Community Health
Survey.” J Expo Sci Environ Epidemiol, PMC, 2 Jul.
2014.
30. Besedovsky, Luciana, et al. “Sleep and immune
function.” Pflugers Arch, Springer, PMC, 10 Nov.
2011.
31. “Secondhand Smoke (SHS) Facts.” Centers for
Disease Control and Prevention, 17 Jan. 2018.
32. Jacob, Peyton, et al. “Thirdhand Smoke: New
Evidence, Challenges, and Future Directions.”
Chem Res Toxicol, PMC, 17 Jan. 2018.
|

Comments
Be the first to comment...